Problem Set 4 - Analyzing a Process with Control Charts#
(Check Canvas for due dates and office hours)
Instructions
Datasets are here (same PW as the course notes)
Use this website for standard normal probability values beyond the printed table
For handwritten-questions, submit as usual (screenshot/picture/export). For excel-based questions, directly submit the excel file.
Textbook problem 5.24. (Find it on Canvas)
Provide relevant specification limits (what you consider appropriate)
Width of a soda can.
Boot time of an operating system.
Number of M&Ms in a “100” labeled packet.
Google review rating on a restaurant.
Delivery time of a food delivery service.
Find the appropriate transformations for the given data (in Excel) to make the given CTQ normal. Show the histograms before and after transformation (check the X-axis properties of histogram in MS Excel to change the number of bins to \(\approx \sqrt{n}\))
A sample of software response times (in milliseconds).
A sample from a measure of uniformity of wafers.
For a two-sided control on mean of a normal CTQ,
Given 3-sigma control limits, what will be the probability of false alarm in the control chart? What will be the average run length for an in-control and stable process?
Given 6-sigma control limits, what will be the probability of false alarm in the control chart? What will be the average run length for an in-control and stable process?
At a Fast-Moving Consumer Goods (FMCG) company, the mean number of dishwasher pods in a packaged box must be 40. If the mean number of pods are 41 or 39 per box, then it is a quality problem that can lead to financial issues (losing materials or losing customers). Few boxes must be tested every 5 minutes from the production line with hundreds of boxes made every minute, and the quality problem must be detected within 30 minutes on average. Assume that the number of pods follow a normal distribution with a standard deviation of 1 pod.
What is the minimum number of test boxes on each 5 minute interval, to detect the quality problem for three-sigma control limits on the process?
What is the minimum number of test boxes on each 5 minute interval, if you need to detect the quality problem within 10 minutes on average (three-sigma control limits)?
Find the natural tolerance limits for a stable in-control process monitored with a three-sigma X-bar chart with lower control limit 9.9 and upper control limit 10.1 with subgroup sizes 9. The product specification is \(10\pm0.3\). Additonally,
Find the process capability. Is the process capable or incapable? If incapable, what is the reason?
What is the fall-out in ppm?
For a two-sided centered-process in statistical control. Calculate the fall-out (in ppm) for
\(C_{pk} = 0.5\)
\(C_{pk} = 1.0\)
\(C_{pk} = 1.5\)
\(C_{pk} = 2.0\) (this is the “Six-Sigma Process”)
Textbook Problem 8.5: A process is in control with \(\bar{\bar{x}} = 100\) and \(\bar{s} = 1.05\), and \(n=5\). The product specifications are at \(95\pm 10\). The quality characteristic has a normal distribution.
Estimate the potential capability.
Estimate the actual capability.
How much could the fallout in the process be reduced if the process were corrected to operate at the nominal specification?
Textbook Problem 8.9: Consider two processes
Process A: \(\bar{\bar{x}}_A = 100\), \(\bar{s}_A = 3\)
Process B: \(\bar{\bar{x}}_B = 105\), \(\bar{s}_B = 1\)
Specifications are at \(100 \pm 10\). Calculate \(C_p\), \(C_{pk}\), and \(C_{pm}\) assuming same subgroup sizes. Which process would you prefer to use?
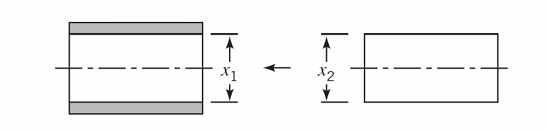
Textbook Problem 8.31: Two parts are assembled as shown in Figure below. The distributions of \(x_1\) and \(x_2\) are normal with \(\mu_1 = 20\), \(\sigma_1 = 0.3\), \(\mu_2 = 19.6\), and \(\sigma_2 = 0.4\). The specifications of the clearance (i.e., \(x_1- x_2\)) between the mating parts are \(0.5 \pm 0.4\). What fraction of assemblies will fail to meet specifications if assembly is at random? (\(Var(x_1 - x_2)\) = \(Var(x_1) + Var(x_2)\))
Textbook Problem 8.36: Two mating parts have critical dimensions \(x_1\) and \(x_2\) as shown in Figure below. Assume that \(x_1\) and \(x_2\) are normally distributed with means \(\mu_1\) and \(\mu_2\) and standard deviations \(\sigma_1 = 0.400\) and \(\sigma_2 = 0.300\). If it is desired that the probability of a smaller clearance (i.e., \(x_1- x_2\)) than 0.09 should be 0.006, what distance between the average dimension of the two parts (i.e., \(\mu_1 - \mu_2\)) should be specified by the designer?
Acknowledgements#
Cosette Bosshardt (Fall 2025)