Module 0 Introduction#
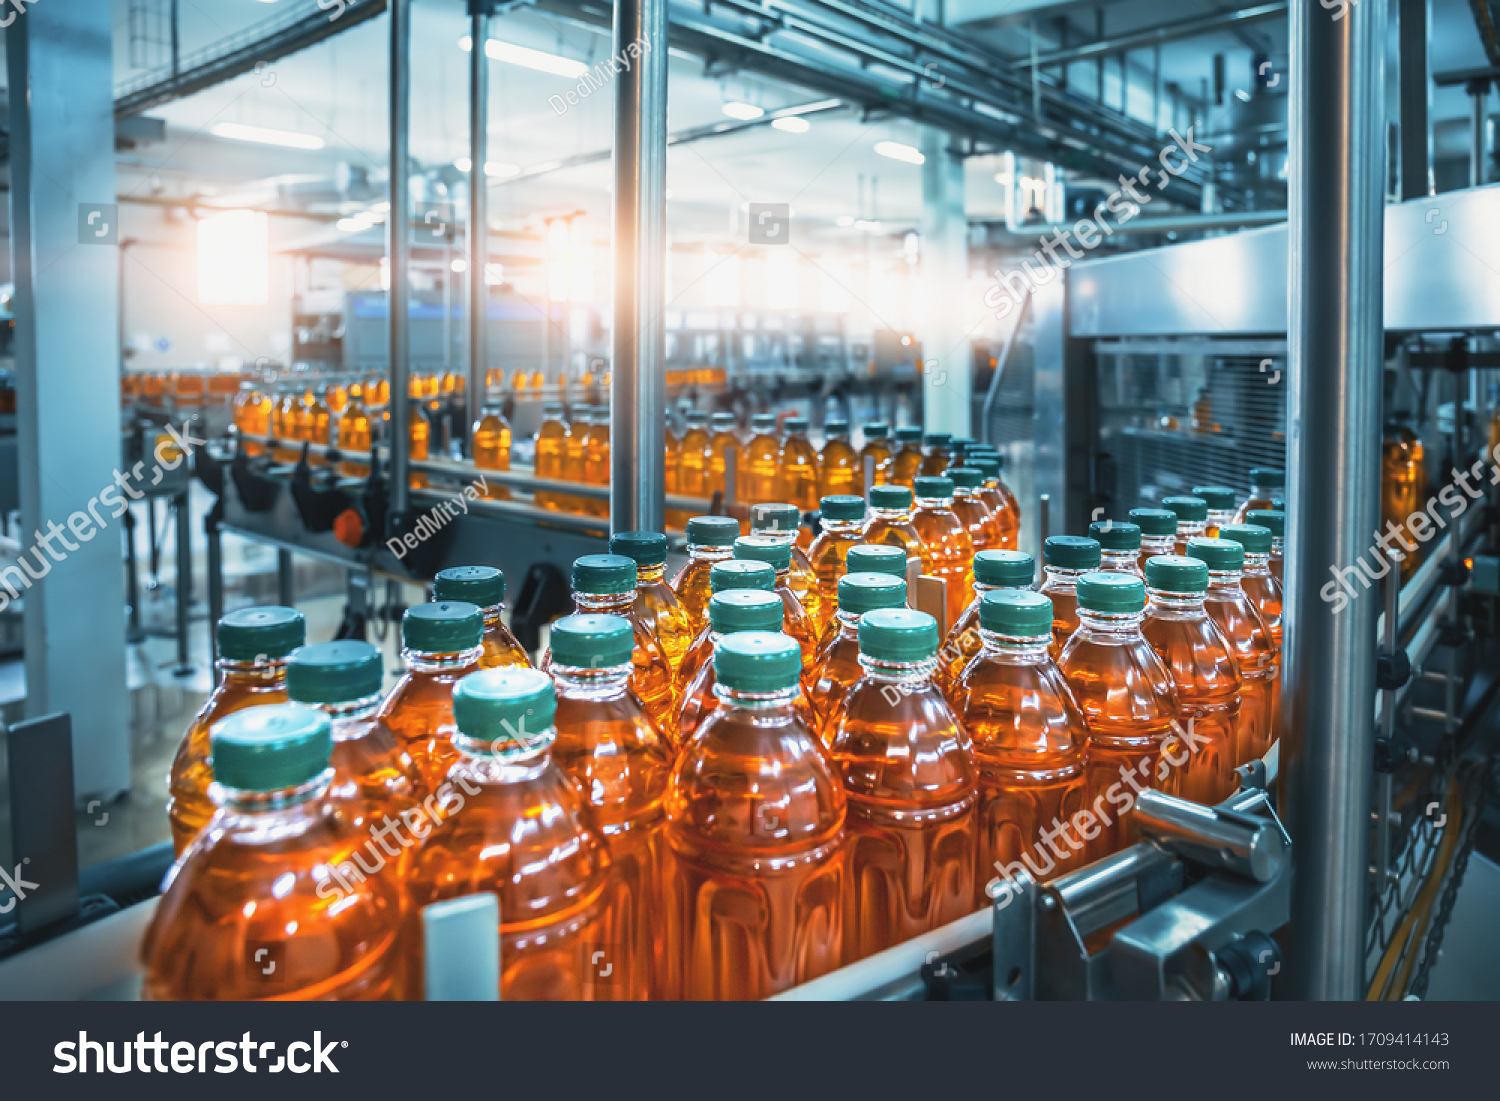
This course is all about quality control in a production line like the one in the figure above.
You are essentially the person below who tests/inspects the products and draws a control chart.

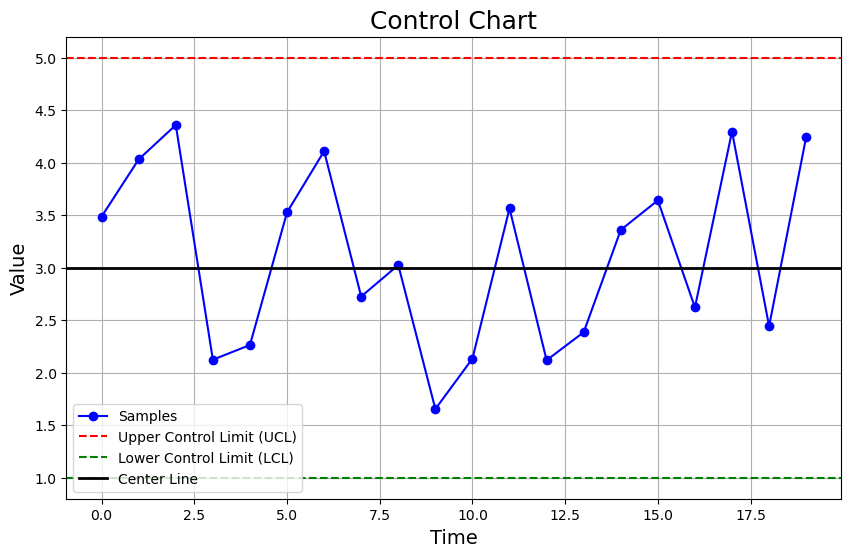
What is a (Quality) Control Chart?#
Control chart is to check that the quality is within limits over time (see plot below).
import sys
import os
# Add the project root to the Python path
project_root = os.path.abspath("..")
sys.path.insert(0, project_root)

from generic_code import *

plot_control_chart(5,3,1,np.random.normal(3,1,20), title = "Control Chart")
Why Mathematics?#
You do not have resources to inspect every single product from the production line.
We need mathematics (particularly statistics) to get everything that makes up the control chart - samples, lower and upper control limits, and center line.
Quality is “conformance to specification” with a large number of products#
“Variability” or “variation” is the opposite of quality.
Quality Control is minimizing variability or keeping the randomness in check.